This year again I had the opportunity to speak during MTS 2010 conference in Warsaw. Last time I have been talking about WF4 and this time the title of my talk was “Introduction to F#”. I would like to thank all attendees for coming! All resources presented during the session are available for download here, here and here. In the near future I’ll publish recording from this session.
Wednesday, October 27, 2010
Monday, October 25, 2010
Debugging Reactive Framework (RxDebugger) and Linq to objects (LinqDebugger)
[New version (2011.05.06)]
[Project download has been upgraded to the newest version of Rx (Build v1.0.2787.0) and VS2010 ] download
(Changes: projects converted to VS2010, sample project for RxDebugger added)
In this post I will present two projects LinqDebugger and RxDebugger. Few months ago after reading Bart De Smet’s great post about tracing execution of the Linq to objects queries I was wondering if it was be possible to implement the same concept but in more general way. If we want to trace the execution of all of the Linq operators using described approach we would have to implement many extension methods, one for each Linq operator. How to avoid this ? LinqDebugger is the the answer ;) . If you are wondering what the lazy evaluation is and how to debug Linq to object queries this project can be very useful. Let’s see a very simple query :
var q =
    from i in Enumerable.Range(0, 12)
    where i > 5 && i % 2 == 0
    select i.ToString("C");

foreach (var s in q)
    Console.WriteLine(s);
Now let’s debug that query:
var q =
    from i in Enumerable.Range(0, 12).AsDebuggable()
    where i > 5 && i % 2 == 0
    select i.ToString("C");

foreach (var s in q)
    Console.WriteLine(s);
After running this code you will find the following text on the console:
Select creation
Select begin
Where creation
Where begin
 predicate i => ((i > 5) && ((i % 2) = 0)) : (0) => False
 predicate i => ((i > 5) && ((i % 2) = 0)) : (1) => False
 predicate i => ((i > 5) && ((i % 2) = 0)) : (2) => False
 predicate i => ((i > 5) && ((i % 2) = 0)) : (3) => False
 predicate i => ((i > 5) && ((i % 2) = 0)) : (4) => False
 predicate i => ((i > 5) && ((i % 2) = 0)) : (5) => False
 predicate i => ((i > 5) && ((i % 2) = 0)) : (6) => True
Where end 6
 selector i => i.ToString("C") : (6) => 6,00 zł
Select end 6,00 zł
6,00 zł
Select begin
Where begin
 predicate i => ((i > 5) && ((i % 2) = 0)) : (7) => False
 predicate i => ((i > 5) && ((i % 2) = 0)) : (8) => True
Where end 8
 selector i => i.ToString("C") : (8) => 8,00 zł
Select end 8,00 zł
8,00 zł
Select begin
Where begin
 predicate i => ((i > 5) && ((i % 2) = 0)) : (9) => False
 predicate i => ((i > 5) && ((i % 2) = 0)) : (10) => True
Where end 10
 selector i => i.ToString("C") : (10) => 10,00 zł
Select end 10,00 zł
10,00 zł
Select begin
Where begin
 predicate i => ((i > 5) && ((i % 2) = 0)) : (11) => False
Where end (no result)
Select end (no result)
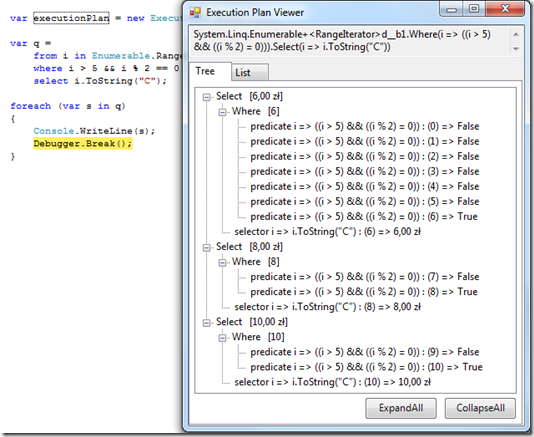
This text shows how the query has been executed. There can find there information about enumerators object creation, about data passing from one enumerator to another and execution of all functions used inside the query. One thing worth mentioning is that everything is presented in the same order as it was executed. Having this information we can easily figure out for example in which iteration the exception has been thrown and what were the values processing by the query at that moment. If such text representation is hard to read for you I also provide the VS visualizer for ExecutionPlan type presenting the same information on the tree control (copy LinqDebugger.dll and LinqDebugger.Visualizer.dll files to C:\Program Files\Microsoft Visual Studio 9.0\Common7\Packages\Debugger\Visualizers folder to make it available).
var executionPlan = new ExecutionPlan();

var q =
    from i in Enumerable.Range(0, 12).AsDebuggable(executionPlan)
    where i > 5 && i % 2 == 0
    select i.ToString("C");

foreach (var s in q)
    Console.WriteLine(s);
I am not going to describe here in details how LinqDebugger has been implemented, you can download the code and check this out yourself. As a hint I will just show you the signature of AsDebuggable method. Please notice what else you can pass to that method. We can choose which operators we want to trace using LinqOperators enum type or pass TextWriter object (Console.Out is set as a default TextWriter).
public static class LinqDebuggerExtensions
{
    public static IQueryable<T> AsDebuggable<T>(this IEnumerable<T> source, ExecutionPlan executionPlan,
        LinqOperators linqOperators, TextWriter textWriter)
    { ... }
}

[Flags]
public enum LinqOperators : long
{
    None = 0,
    Aggregate = 1,
    All = 2,
    Any = 4,
    AsQueryable = 8,
    Average = 16,
    Cast = 32,
    Concat = 64,
    Contains = 128,
    ...
}

[Serializable]
public sealed class ExecutionPlan
{
    public Expression Query { get; internal set; }
    public List<Record> Records { get; }
    public void Reset();
}

[Serializable]
public class Record
{
    public RecordType RecordType { get; internal set; }
    public MethodCallExpression OperatorCallExpression { get; internal set; }
    public object Result { get; internal set; }
    public LambdaExpression FuncCallExpression { get; internal set; }
    public string FuncCallName { get; internal set; }
    public object[] Arguments { get; internal set; }
}
Tracing similar information during Rx queries execution is even more useful because in most cases such queries are executed asynchronously so debugging them is really hard. Let’s debug Rx version of previous query using RxDebugger:
var q =
    from i in Enumerable.Range(0, 12).ToObservable().AsDebuggable(
        new DebugSettings {SourceName = "range", Logger = DebugSettings.ConsoleLogger})
    where i > 5 && i % 2 == 0
    select i.ToString("C");

q.Run(Console.WriteLine);


range.Where.Select.Subscribe()
range.Where.Subscribe()
range.Subscribe()
range.OnNext(0)
range.OnNext(1)
range.OnNext(2)
range.OnNext(3)
range.OnNext(4)
range.OnNext(5)
6,00 zł
range.OnNext(6)
range.Where.OnNext(6)
range.Where.Select.OnNext(6,00 zł)
range.OnNext(7)
8,00 zł
range.OnNext(8)
range.Where.OnNext(8)
range.Where.Select.OnNext(8,00 zł)
range.OnNext(9)
10,00 zł
range.OnNext(10)
range.Where.OnNext(10)
range.Where.Select.OnNext(10,00 zł)
range.OnNext(11)
range.OnCompleted()
range.Where.OnCompleted()
range.Where.Select.OnCompleted()
range.Where.Select.Dispose()
range.Where.Dispose()
range.Dispose()
As you can see this time a quite deferent information displayed on the screen and there is no VS visualizer available. It’s because the implementation of RxDebugger is totally different from LinqDebugger. But there are some additional features too. To understand how RxDebugger works I will show you the Debug method which gives us ability to trace single observable object instead of the whole Rx query.
var q =
    from i in Enumerable.Range(0, 12).ToObservable().Debug(
        new DebugSettings {SourceName = "range", Logger = DebugSettings.ConsoleLogger})
    where i > 5 && i % 2 == 0
    select i.ToString("C");

q.Run(Console.WriteLine);

range.Subscribe()
range.OnNext(0)
range.OnNext(1)
range.OnNext(2)
range.OnNext(3)
range.OnNext(4)
range.OnNext(5)
6,00 zł
range.OnNext(6)
range.OnNext(7)
8,00 zł
range.OnNext(8)
range.OnNext(9)
10,00 zł
range.OnNext(10)
range.OnNext(11)
range.OnCompleted()
range.Dispose()
public static IObservable<T> Debug<T>(this IObservable<T> source, DebugSettings settings, Func<T, object> valueSelector)
{
    Action<T> onNext = v => { };
    if ((settings.NotificationFilter & NotificationFilter.OnNext) == NotificationFilter.OnNext)
        onNext = v =>
        {
            if (settings.Logger != null)
                settings.LoggerScheduler.Schedule(() => settings.Logger(DebugEntry.Create(settings, NotificationFilter.OnNext, valueSelector(v))));
        };

    Action<Exception> onError = ... ;
    Action onCompleted = ... ;
    Action subscribe = ... ;
    Action dispose = ... ;

    return Observable.CreateWithDisposable<T>(o =>
    {
        var newObserver = Observer.Create<T>
        (
            v => { onNext(v); o.OnNext(v); },
            e => { onError(e); o.OnError(e); },
            () => { onCompleted(); o.OnCompleted(); }
        );

        subscribe();
        var disposable = source.Subscribe(newObserver);

        return Disposable.Create(() =>
        {
            dispose();
            disposable.Dispose();
        });
    });
}

public sealed class DebugSettings
{
    // defaults
    public static Action<DebugEntry> DefaultLogger { get; set; }
    public static IScheduler DefaultLoggerSchduler { get; set; }
    public static string DefaultMessageFormat { get; set; }

    //loggers
    public static Action<DebugEntry> ConsoleLogger { get; private set; }
    public static Action<DebugEntry> DebugLogger { get; private set; }

    public string MessageFormat { get; set; }
    public Action<DebugEntry> Logger { get; set; }
    public IScheduler LoggerScheduler { get; set; }
    public string SourceName { get; set; }
    public NotificationFilter NotificationFilter { get; set; }
    public OperatorFilter OperatorFilter { get; set; }

    static DebugSettings()
    {
        ConsoleLogger = n => Console.WriteLine(n.FormattedMessage);
        DebugLogger = n => Debug.WriteLine(n.FormattedMessage);

        DefaultLogger = DebugLogger;
        DefaultLoggerSchduler = Scheduler.CurrentThread;
        DefaultMessageFormat = "{0}.{1}({2})";
    }

    public DebugSettings()
    {
        SourceName = "";
        NotificationFilter = NotificationFilter.All;
        OperatorFilter = OperatorFilter.AllOperators;

        Logger = DefaultLogger;
        LoggerScheduler = DefaultLoggerSchduler;
        MessageFormat = DefaultMessageFormat;
    }
}

public class DebugEntry
{
    public string SourceName { get; set; }
    public string FormattedMessage { get; set; }
    public NotificationFilter Kind { get; set; }
    public Exception Exception { get; set; }
    public object Value { get; set; }
}
Debug method creates a new observable object on the top of given observable sources. Each observer passed to this observable source is wrapped into a new observer tracing information about calling Subscribe, Dispose methods at the IObservable level and OnNext, OnError, OnCompleted methods at the IObserver level. We can provide filter on Rx operators (OperatorFilter enum type) or logged information (NotificationFilter enum type). In LinqDebugger project TextWiter class has been used to log information. Here we have much more flexible solution because we can pass delegate type responsible for storing logged information. RxDebugger provides standard loggers such as DebugSettings.ConsoleLogger or DebugSettings.DebugLogger but we can also set our own delegate type or even merge many different logger delegates. Such a scenario will be presented in further part of the post. Once we know how Debug method works let’s reveal the secret behind the AsDebuggable method.
public interface IDebuggedObservable<T> : IObservable<T>
{
    DebugSettings Settings { get; }
}

public static partial class RxDebuggerExtensions
{
    public static IDebuggedObservable<T> AsDebuggable<T>(this IObservable<T> source, DebugSettings settings)
    {
        return new DebuggedObservable<T>(source.Debug(settings), settings);
    }

    public static IDebuggedObservable<TSource> Where<TSource>(this IDebuggedObservable<TSource> source , Func<TSource,bool> predicate)
    {
        var settings = source.Settings.Copy();
        settings.SourceName = settings.SourceName +  ".Where";
        return new DebuggedObservable<TSource>((source as IObservable<TSource>).Where<TSource>(predicate).Debug(settings), settings);
    }
    public static IDebuggedObservable<TResult> Select<TSource,TResult>(this IDebuggedObservable<TSource> source , Func<TSource,TResult> selector)
    {
        var settings = source.Settings.Copy();
        settings.SourceName = settings.SourceName +  ".Select";
        return new DebuggedObservable<TResult>((source as IObservable<TSource>).Select<TSource,TResult>(selector).Debug(settings), settings);
    }
    ...

    private class DebuggedObservable<T> : IDebuggedObservable<T>
    {
        private readonly IObservable<T> _source;
        private readonly DebugSettings _settings;
        public DebugSettings Settings { get { return _settings; } }

        public DebuggedObservable(IObservable<T> source, DebugSettings settings)
        {
            _source = source;
            _settings = settings;
        }
        public IDisposable Subscribe(IObserver<T> observer)
        {
            return _source.Subscribe(observer);
        }
    }
}
Of course I didn’t implement extension methods for all Rx operator manually, I wrote T4 template generating appropriate extension methods (currently 127 methods in .Net version and 125 methods in Silverlight version :) ). The best way to use RxDebugger in your projects is to add T4 template to the project you are working on and run template every time you change the version of Rx. It allows you to always be synchronized with Rx dlls. Finally let’s see how to use RxDebugger in Silverlight application.
<UserControl x:Class="Blog.SL.Post016.RxDebuggerTest"
    xmlns="http://schemas.microsoft.com/winfx/2006/xaml/presentation"
    xmlns:x="http://schemas.microsoft.com/winfx/2006/xaml"
    xmlns:d="http://schemas.microsoft.com/expression/blend/2008"
    xmlns:mc="http://schemas.openxmlformats.org/markup-compatibility/2006"
    mc:Ignorable="d" d:DesignWidth="640" d:DesignHeight="480">
    <StackPanel>
        <TextBox x:Name="input"/>
        <TextBox x:Name="output"/>
        <ItemsControl x:Name="log"/>
    </StackPanel>
</UserControl>
public partial class RxDebuggerTest : UserControl
{
    public RxDebuggerTest()
    {
        InitializeComponent();

        var entries = new ObservableCollection<DebugEntry>();
        log.ItemsSource = entries;

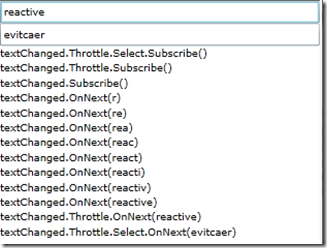
        var q = input
            .GetObservableTextChanged()
            .Select(e => ((TextBox)e.Sender).Text)
            .AsDebuggable(new DebugSettings
                              {
                                  SourceName = "textChanged",
                                  LoggerScheduler = Scheduler.Dispatcher,
                                  Logger = DebugSettings.DebugLogger + entries.Add,
                              })
            .Throttle(TimeSpan.FromSeconds(2))
            .Select(t => new string(t.Reverse().ToArray()));

        q.ObserveOnDispatcher().Subscribe(t => output.Text = t);
    }
}
And that’s it for the post. I encourage you to download and play with the two simple tools I provided here. They can be very helpful in debugging LINQ quires or learning about the internals of LINQ and Rx.
downlaod (Rx versions: .Net3.5 v1.0.2698.0 and SL3 v1.0.2698.0) Always check for newest version at the beginning of the post.


